Advanced TS

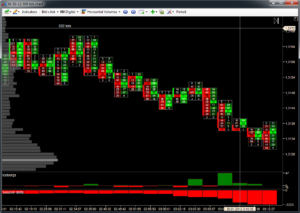
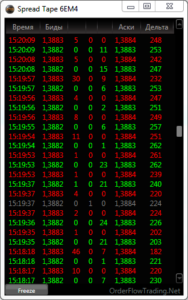
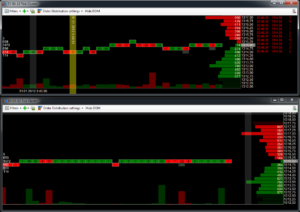
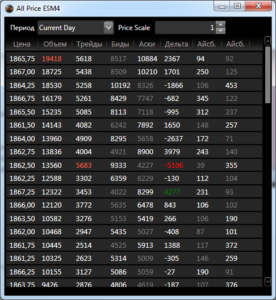
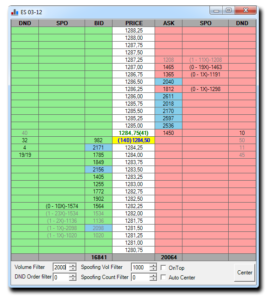
Advanced TS powered by Rithmic , CQG, and CTS data technology is a professional trading and analytical platform designed for order flow analysis. It has all traders need for fast and convenient market evaluation – Time And Sales, Level II data (Depth of Market or DOM) and HFT algorithms tracking. ATAS platform processes the order flow data and visualizes it in an intuitive form. It features extensive filtering capabilities and flexible setup. Advanced TS analytical instruments improve the information value of the market data.

Server co-location is available for traders wanting closer proximity and lower latency connection though a Dedicated Trading Server, or Virtual Private Server.

Advanced TS Platform Fee

  • 1 Month: $74

  • 3 Months: $195

  • 6 Months: $330

  • 12 Months: $540

  • Lifetime: $1,990

Data Technology Fee

  • Rithmic – $20/Month + $0.25/Contract

  • CQG – $10/Month + $0.10/Contract

  • CTS – $25/Month + $0.50/Contract

  • CTS Fee Cap – $500/Month

Advanced TS Overview

Volume Analysis

  • There’s much more than just charts. Visual analysis of order flow, cluster analysis, volume profile of markets, etc. allow viewing the markets from the inside and realizing its motivation.

Time Frames

  • Alternative time frames of charts: seconds, tick, reversal, range, volume, delta, and many more.

Filters

  • Unique set of filters and indicators shows the most current market situation.

Spread Charts

  • There is a possibility to set different formulas using any numbers of instruments, thus creating synthetic instruments. This option will be useful for portfolio analysis and pair arbitrage trade.

History

  • Analysis of historical data (every tick, every trade) with possibility to link Print Tape to a chart. There are also continuous contracts for analysis at long time period available.

Volume Analysis

  • There’s much more than just charts. Visual analysis of order flow, cluster analysis, volume profile of markets, etc. allow viewing the markets from the inside and realizing its motivation.

Device Frame
Device Frame

Smart Tape

Combines individual prints back together (the way it used to be before 2009) so that you can easily see the actual market orders to their full extent. There are also filters available in the Smart Tape so you easily sense what the bigger/smaller traders are doing at the moment.

Also the Smart Tape is capable of displaying some other essential information including Iceberg Orders, and much more.

Spread Tape

This module allows to see the volume of trades, which were settled based on bid and ask in the process of the price movement. Thus, trades behavior can be analyzed at any given time while approaching a certain price level. You can also see the volume settled inside the spread, and cumulative delta (calculated using data of all available prints from bottom to top).

Device Frame
Device Frame

Tick Cluster

All calculations are similar to those used in Smart Tape, but info gets displayed in the form of clusters. This innovative approach makes it easier to embrace all the info (same info you see in the Smart Tape) in a form of a Tick Cluster chart. It allows you to see market orders executed with slippage. Also on a Tick Cluster chart traders can see distribution of the current day volumes and Level II (DOM) data.

All Price

This counter calculates volume for every price level. Allows you to locate price levels with max volume/bid/ask/delta/icebergs for a period of time of your choice. Many traders use these levels for their trading strategies.

Device Frame
Device Frame

Smart DOM

This innovative tool designed to spot and analyze activity of high frequency algorithms – HFTs.

It allows traders to:

  • To highlight large orders

  • To see Iceberg (DND – Do Not Display) orders

  • To spot activities of spoofing algorithms

Spoofing algos mostly designed to mislead you. For example a spoofing algo makes an order visible in the DOM for 9/10 of a second then within 1/10 of a second removes it from the DOM and puts it back on. It’s difficult for human eyes to sense these changes, therefore, it creates an impression of a big order.

Chart

  • Construction of tick, one-minute and RangeX charts

  • Clustering of data. Each bar can be viewed “from the inside” (it can be seen what volumes, bids, asks, deltas were on each price of the given bar)

  • Linked windows creation. Any of the modules mentioned above can be created using the chart. The counters, at that, are linked to the chart.

  • History viewing. If linked windows were created, any bars in which you want to view data can be marked in the chart. When specifying the interval, information for the marked range will be displayed in linked windows. This makes testing ideas using history very simple and convenient.

  • Display of large market spikes in the chart. It is possible to create any number of filters for orders which will be displayed in the charts. (BigTrades Indicator)

  • Bar chart of volumes with the possibility to choose initial and finite interval (display options: Volume, Trades, Bid-Ask, Delta, Icebergs).

  • A whole range of innovative indicators allowing transformation of order flow into a comprehensible form, easy and clear for visual perception.

Device Frame