MultiCharts.NET

MultiCharts.NET | Rithmic | CQG

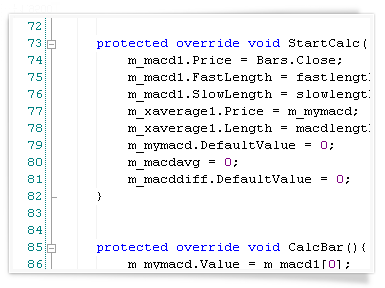
MultiCharts.NET powered by Rithmic and CQG data technology combines the best features of MultiCharts platform with the endless possibilities of .NET. It combines powerful tradng features with simplicity of EasyLanguage. Professional programmers often prefer the powerful .NET laungauge to create indicators and strategies. MultiCharts.NET opens new doors for C# and VB.NET developers. MultiCharts.NET is tightly integrated with Microsoft Visual Studio allow traders to debug indicators and strategies in a familiar way.

Server co-location is available for traders wanting closer proximity and lower latency connection though a Dedicated Trading Server, or Virtual Private Server.

MultiCharts Platform Fee

  • 1 Month – $79

  • 12 Months – $797

  • Lifetime – $997

Data Technology Fee

  • Rithmic – $20/Month + $0.25/Contract

  • CQG – $10/Month + $0.10/Contract

C# Development

MultiCharts.NET was engineered specifically for experienced programmers. C# is a powerful and flexible language, which allows traders to express any idea. VB.NET is also available.

MultiCharts.NET allows traders to build a strategy out of many trading signals. Traders can use pre-built examples, or program a new one.

.NET Advantages

MultiCharts .NET was engineered specifically for programmers who use VB.NET and C#. The .NET framework has a more flexibility than PowerLanguage, with a few key features outlined below:

  • GDI Drawing on Charts

  • Access to Complete Account Information

  • Create Custom Toolbars

  • Access Data of Any Symbol from Scripts

Chart Analysis

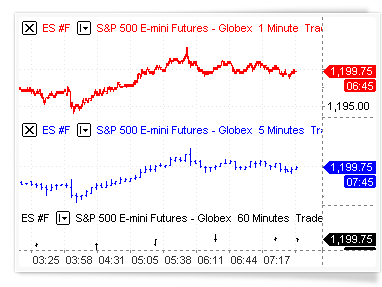
Charting is one of the most important aspects of MultiCharts .NET. Traders need to see precise price movements to determine the next move. Charting software needs to be flexible, so that traders can adjust any part of it to their particular needs. The new 64-bit version of MultiCharts lets traders easily view charts of any length, limited only by the amount of memory in your computer.

Real-Time Market Scanner

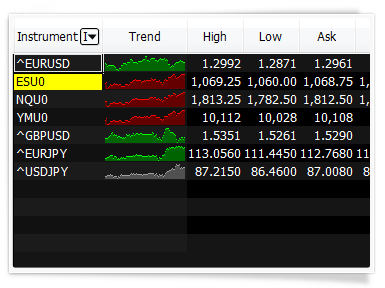
Scan all symbols universe one-by-one with a specified frequency and at the same time monitor hundreds of selected instruments in real-time. Now thousands of instruments can be automatically sorted out from the whole market according to your indicator criteria for further updating in real-time.

Market Scanner is a watchboard for monitoring symbols traders are interested in and finding opportunities. The new version of the Scanner has two components: Pre-Scanning and Watchlist windows. While a single chart gives traders details about one symbol, the Scanner allows traders to spot opportunities among thousands of symbols.

Market Data Replay

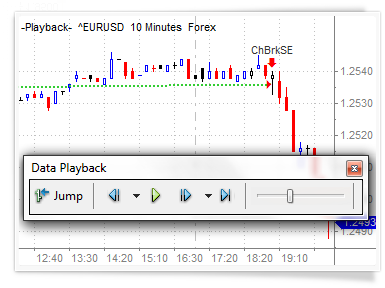
Market replay is a great way to learn about trading without risking money. This feature is especially important for discretionary traders who use price patterns and other methods, which are difficult to incorporate into trading models and strategy trading

Market data replay can playback historical data at any speed. Traders have complete control over how quickly market changes are displayed. For example, playback a month of minute data in just a few seconds.

Strategy Backtesting

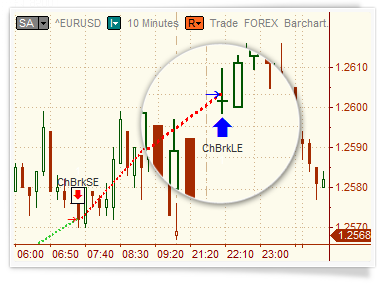
Strategy backtesting is an essential tool to see if a strategy works or not. Backtesting software simulates a strategy on historical data and provides a backtesting report, which allows traders to conduct proper trading system analysis.

MultiCharts .NET is a solution created specifically for strategy development and backtesting. MultiCharts.NET philosophy is that strategy backtesting should be as realistic as modern technology allows – that’s why MultiCharts.NET use multi-threading and 64-bit technology.

Automated Trading

Even with a strategy, just a short delay in order execution can make all the difference. After developing a strategy, the next step is to actually send the orders. The key advantage of automated trading is that it can send orders a lot faster than a human being, and this can give traders an advantage over the competition.

Orders generated by a trading strategy in MultiCharts .NET are sent directly to the broker’s server. Then the broker responds with a message about the order status, and traders can see on the chart if the trade was successful.

Portfolio Trading

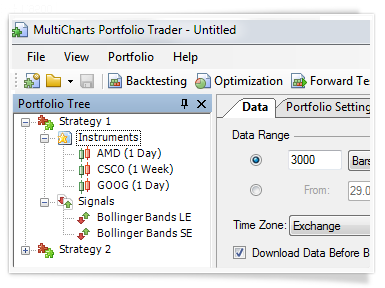
Portfolio Trader is a very powerful tool to test and autotrade entire portfolios, which can contain 100’s of futures, and other instruments. It’s such a powerful tool that it’s often sold as a separate application, but included with MultiCharts .NET. MultiCharts .NET 64-bit easily handles huge amounts of data needed when managing a portfolio.

Portfolio backtesting means applying one or more strategies to many instruments at once—testing on historical data and gauging performance as if all symbols were traded with these strategies. Different symbols can even have different resolutions during the testing—one tick, three minutes, nine days, or others.

Order and Position Tracker

This window gives a detailed summary of orders, positions, and accounts across all brokers being used for trading. Cancel or modify pending orders, or even flatten entire positions, directly from this window. All information is in one convenient place – it can be sorted and filtered to zoom in on needed details. This information can also be exported into Excel for further analysis. In MultiCharts .NET, all of this information is available directly in scripts.

Monitor information from different brokers at the same time all in one place and view account equity across all accounts.

Trading From The Chart

Trading from a chart is one of the most popular approaches by discretionary traders – for good reason. Traders can see price movements along with indicators, and recognize where appropriate levels will be for price action.

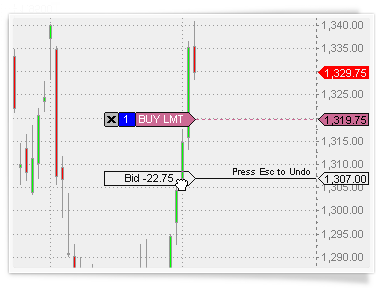
Visual chart trading keeps pace with traders needs and they can intuitively drag and drop order onto your chart – no need to calculate the necessary price and type it in. An order can always be moved to another level if desired. Entire entry and/or exit strategies, like single orders, may also be dropped into a chart.

To change where orders are located, simply drag them up or down. Don’t like the new location of an order? Simply press Escape and the order will return to its original position.

Depth of Market (DOM)

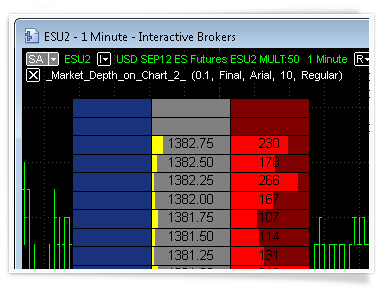
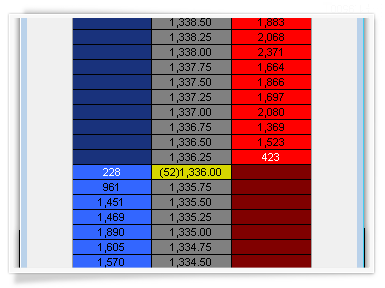
This industry-standard tool shows market depth and provides one-click trading. MultiCharts .NET’s DOM displays ten price levels each way and allows entry and exit automation directly in the DOM window. See volume at different prices to analyze how supply and demand are interacting and where prices may go.

DOM in MultiCharts .NET has two modes of operation: dynamic and semi-static. Simply choose the mode through a right-click.

Visual Trading

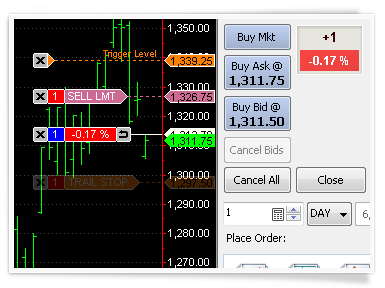
Visual trading lets traders conveniently drag-and-drop orders onto a chart or DOM and quickly adjust them by simply dragging them around. Visual price levels are much more intuitive than the traditional way of typing in exact orders and prices. It’s like the visual interface in modern Windows, as opposed to old-style DOS with only typing. Traders get a whole new level of comfort, ease of use, and functionality.

Traders need to place orders accurately and quickly to succeed in trading. MultiCharts .NET features many tools to help you achieve your goals – Chart Trading, Trade Bar, Order and Position Tracker, Depth of Market, Automation of Entries and Exits, and Symbol Mapping.