Call Us: (312)241-1982

VolFix.NET
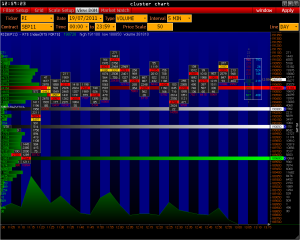
Cluster Chart
It is created in order to visualize the volume inside the bars in all price levels.
It is equipped with the most modern systems of volume fixing and structuring.
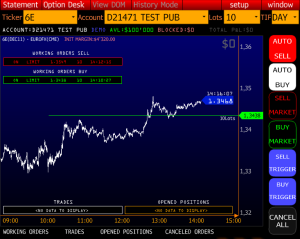
Order Window
The window created for placing orders directly from the chart. It is equipped with innovative window of applications.
The process of placing orders is ideal for professional trading and meets the requirements of the new activity of electronic markets.
Modern interface of the window sets a completely new format for conducting of transactions. The window is also equipped with a group of services for creating personal strategies.
Box Chart
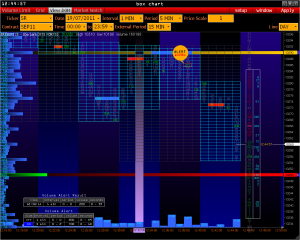
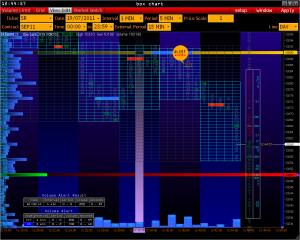
Innovative chart of volume visualization that inherits the basic principles of structuring data and is equipped with the most modern system of data fixing.
It is designed for the most precise entrance into the market. The module that displays market depth (pending orders) is implemented.
The module is visualized in innovative format and exists only in VolFix.NET.
Cluster Profile
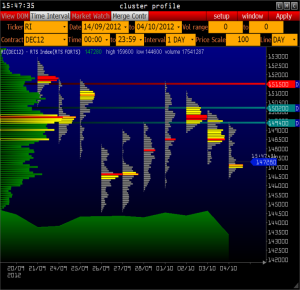
Interface is specially designed to optimize analytical process.
Perfect format of working with futures data allows to implement long-term concepts and synchronize short-term actions with mainstream trend.
Tick Chart
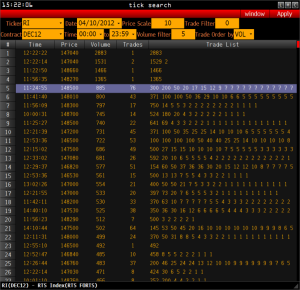
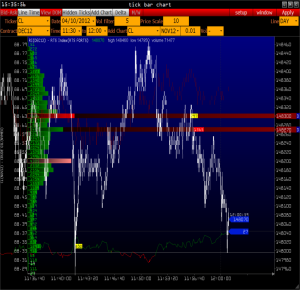
Tick Chart is oriented on analysis of intra minute processes. Provides access to history of ticks for 600 days.
Format of data visualization in Tick Chart offers revolutionary advantages for intra-day traders
Bar Chart
Perfect bar chart, equipped with search-oriented interface (designed for professional structuring of horizontal volume) that created classical information space for the mid-term evaluation of the market situation.
Combo Bar Chart
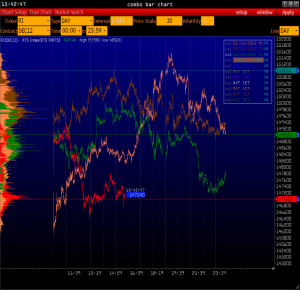
Combined analytical bar chart with ability to display different time periods of equal length simultaneously.
Opportunity to see the entire futures contract in the form of ten-minute bar charts in window, where 10 time periods are displayed at the same time is one of the features provided within the services which are oriented on work with tick databases.
Bars are equipped with filtration system and visualize maximum volumes with unconventionally high values.
Market Watch
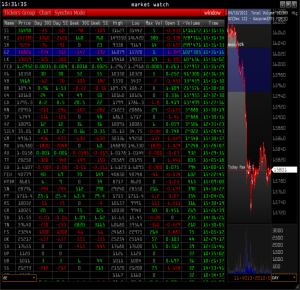
Manageable table of the instruments that visualize market in digital form. For example: current price and delta of the maximum amount of 5-30% of the previous day or week are available.
Classic deltas are also visualized. Table can be synchronized with any window of the platform.
Volume Profile
Function that complements the capabilities of Combo Bar module.
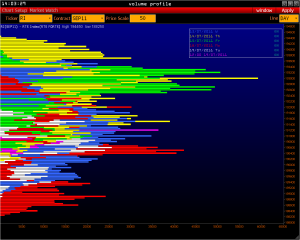
It visualizes horizontal volume of different time periods with equal length. Capability of autonomous usage in combination with other windows of the platform.
Simultaneously it visualizes horizontal volumes of unequal time periods.
All Price
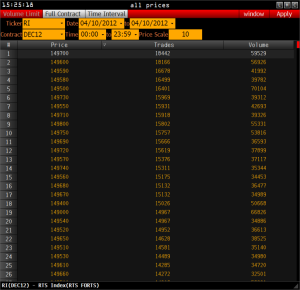
Universal volume counter. Designed for analytical work with historical data. Data for 600 days is available. It is a classic element of any program that works with historical data.
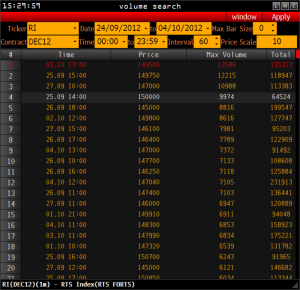
Volume Search
Searcher-counter of time cluster, designed for working with Cluster Chart, Cluster Profile, Box Chart, and Classic Profile.
It allows visualizing the rating of bars by data and time of the trading session. It was first introduced in VolFix.NET.
