Call Us: (312)241-1982

MotiveWave


MotiveWave powered by Rithmic and CQG data technology is a well-established developer of easy-to-use full-featured charting, analysis and trading software built for the individual trader. MotiveWave has very advanced charting and drawing tools that are highly customizable and yet still easy-to-use, and also specializes in advanced analysis tools like Elliott Wave, Fibonacci, Gartley, Gann and Ratio Analysis. Plus, MotiveWave has all of the features (and more) that traders would expect in a professional standalone trading platform, including scanners, strategy trading, custom strategies, backtesting, optimization (genetic and exhaustive), replay mode, walk-forward testing, reporting, and trade simulation. MotiveWave has a product to fit any budget and trading style and is available for Windows and Mac.
Chart Trading
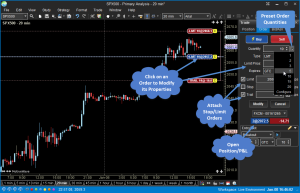
Place orders directly from the price axis with a single mouse click. Limit Buy/Sell orders can be placed at a specific price by clicking above or below the current price. Keyboard modifiers such as “Ctrl”, “Shift” or “Ctrl+Shift” can be used to place specific types or combinations of orders when clicking on the price axis.
Orders can be adjusted or cancelled directly from the chart. Just drag a label to adjust the price or click the ‘C’ button to cancel an open order.
Depth-of-Market (DOM)
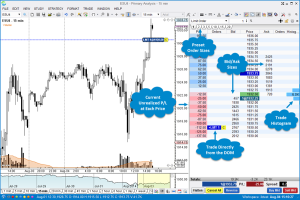
The Depth Of Market (DOM) panel displays bid and ask sizes beyond the best bid/ask in a tabular format. Orders can be placed and managed directly from the DOM and current profit/loss of open positions are displayed for each price level. The DOM may also be opened in a separate window for convenience.
Console
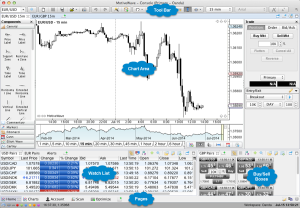
Use the console to organize charts, watch lists and other utilities all within one window. The console comes with a default set of pages and layouts.
Pages allows traders to organize and manage different layouts all within a single window. Use the Page Bar at the bottom of the Console window to switch between layouts. Several pages are created as part of the default layout. Add, remove or modify these pages to customize a unique preferences.
Elliot Wave
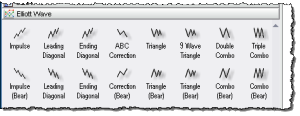
MotiveWave has the most advanced Elliott Wave Software and Elliott Wave Tools available. Elliott Wave Tools range from manual to semi-automatic to automatic Elliott Wave to suit your preference. Elliott Wave labels are always automatically added, cutting down analysis time significantly. Manual Elliott Wave tools lets traders plot wave counts easily. Auto Elliott Wave tool will fill in Elliott Wave counts automatically on one chart based on a selected area of a chart. Auto Analyze Elliott Wave tool will automatically plot Elliott Waves over a specified range of data to a specified level of decomposition on one chart. The Elliott Wave Scanner (pattern recognition tool) allows traders to search for specific Elliott Wave Patterns across multiple symbols/instruments based on options traders choose. All wave counts can be moved or adjusted after being placed on the chart and can be decomposed as many levels as desired.
Harmonic Patterns
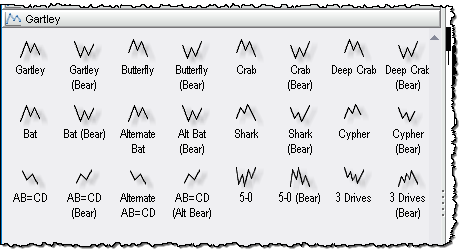
MotiveWave has a very advanced set of Gartley tools that come in manual, semi-automatic and automatic Gartley to suit traderspreference. There are 24 manual Gartley components (bull and bear) that can be added to the charts, including Gartley pattern, Butterfly, Crab, Bat and more. Shaded areas and ratio label guides allows traders to easily place points on the chart to wire up the patterns correctly. Auto Gartley tools allows traders to select an area of a chart to search for either a Gartley or ABCD pattern. The Gartley Scanner (pattern recognition tool) allows traders to search for specific Gartley Patterns across multiple symbols/instruments based on options you choose. All Gartley patterns can be moved or adjusted after being placed on the chart.
Alternate Analyses
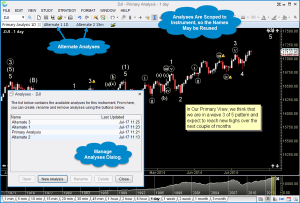
MotiveWave has a unique concept of creating an alternate analysis. It is normally used with Elliott Wave analysis for exploring alternate outcomes, but can be used for any advanced technical analysis. Charts in MotiveWave can be saved so analysis will not get lost. An alternate analysis lets traders look at a possible diverging outcome in a separate chart so traders don’t have two analyses competing or looking too busy on a chart. traders can choose to start Alternate Analysis based on an existing chart and make appropriate changes to the new chart or start an Alternate Analysis from a clean blank chart. Either way, original analysis are saved and will not be changed.
Studies
With over 275 built-in studies, traders are sure to find what they are looking for. MotiveWave has a lot of advanced study features to provide traders with the flexibility that they need.
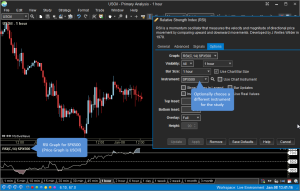
Studies of different bar sizes may be displayed on the same chart. For example, traders can overlay a 1 day moving average on a 15 minute chart or display a 5 minute RSI on a 1 hour chart.
Strategies
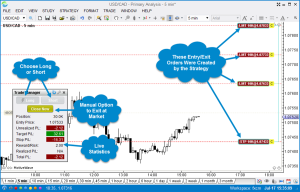
Strategies may be used to fully or partially automate trading. MotiveWave comes with over 30 strategies out of the box and traders can create their own strategies using our Java SDK. Source code for our existing strategies can be made available upon request.
MotiveWave comes with several fully automated strategies. Choose a strategy and click on the Activate button to begin trading. Partially automated strategies allow for this level of flexibility. Optionally choose when to enter a position and when to close and exit the strategy.
Replay Mode
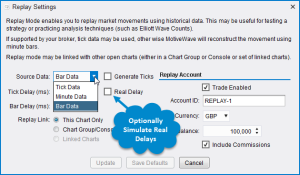
Use Replay Mode to validate a market theory, test an automated strategy or to practice the Elliott Wave counts. MotiveWave’s advanced Replay Mode provides the flexibility and functionality traders need to simulate a trading environment using historical data.
When Replay Mode is initiated, a special replay account is created to manage and track the trades that are created. Each replay session is assigned its own replay account so traders can run multiple replay sessions at the same time.
Strategy Backtesting
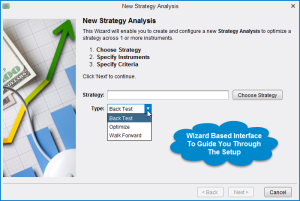
MotiveWave provides powerful tools to enable traders to test and optimize strategies using historical data. Use wizard-based interface to guide through the process. Testing may be performed using actual tick data provided by the data service. If this data is not available, MotiveWave can generate ticks using historical bars and even minute-based bars.
Drawing Tools
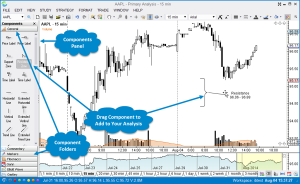
MotiveWave comes with over 180 specialized drawing components and dozens of drawing tools. Open the Components Panel for easy access. Simply click and drag components onto a chart to add them to ananalysis.
Use the tools dropdown to select a drawing tool. For convenience, the tool bar may be customized to add frequently used tools.
Scanner
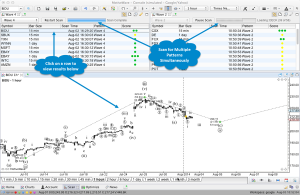
Use the scanning features to look for trading opportunities across a wide range of instruments and bar sizes. MotiveWave’s intelligent pattern matching algorithms allow traders to search for:
-
Elliott Wave – Search for Elliott Wave Patterns
-
Harmonic (Gartley) Patterns – Search for Gartley Harmonic Patterns
-
Study Conditions – Search for Study Conditions using one or more studies
