Call Us: (312)241-1982

S5 BookMap


S5 BookMap powered by Rithmic and CQG data technology offers a unique perspective when watching the Depth of Market (DOM) dynamics & order book flow. Traders of all time frames and genres are demanding more. More transparency. Clearer insights into not only price and time but limit order book information as well. Todays traders are becoming more sophisticated, more aware and more educated. Traders are demanding a different class of tool, a different platform born in the world of sub second data and BookMap delivers.
There is no transparency in the market today. Traders don’t have a way to analyze in real time or offline the activity taking place in the order book and order flow. Therefore, traders are essentially trading the market blindfolded. All current charting tools provide filtered or aggregated perspective of market action not allowing traders to get real insight into actual supply and demand thus leaving them shortsighted as far as real time price action is concerned.
Market depth is being updated in real time and it changes constantly throughout the trading session. On an instrument such as the E-mini S&P 500 futures contract (ES), which trades under extremely high volume, the market depth updates many times each second and therefore it is very hard to follow those changes.
What is S5 BookMap?
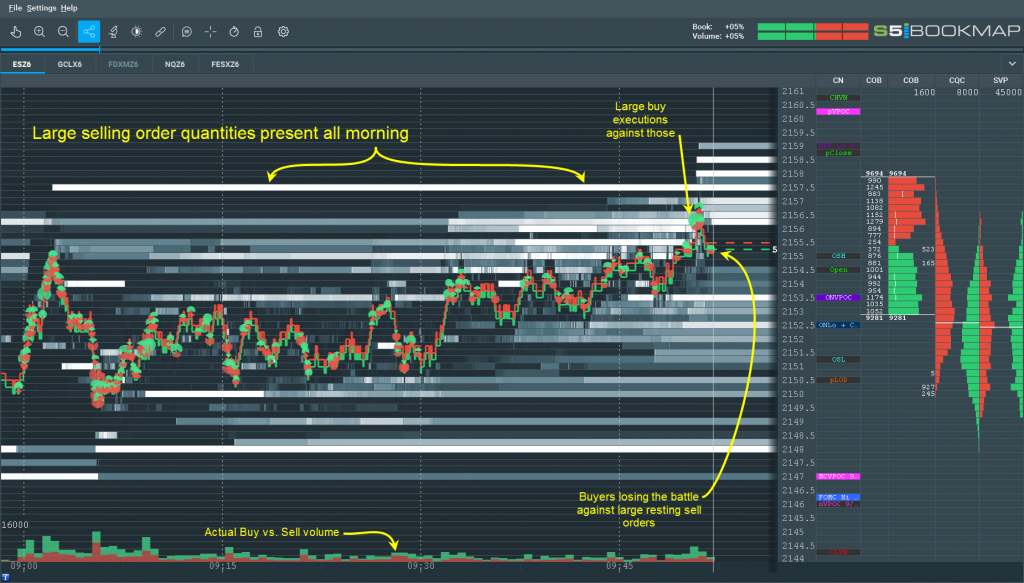
S5 BookMap is an innovative platform that provides traders with clearer transparency into the market. At the heart of S5 BookMap is the Order-Book Heat-Map that visualizes market depth dynamics and evolution over time. The heat map delivers the real time non-aggregated non-filtered market data and helps traders instantaneously observe market depth dynamics and the flow of liquidity, allowing traders to gain better insight into short term price action.
S5 BookMap allows traders to connect directly to today’s most popular data and execution gateways.
How does it work?
S5 BookMap enables traders to watch not only the current snapshot of the DOM but also the historical changes. The heat map records and visualises every change in the order book by displaying it on a scale of gray shade. The brighter shades mark price levels with larger number of resting paper while darker shades mark areas of lower liquidity.


How is it different from any other charting platform out there?
Traders will not find the classical bars and candles or other forms of aggregated data. Traders will not see the chart shifts once in awhile to add a new bar. Instead, traders will see an HD movie that visualizes gigabytes of non-aggregated market data (both trades and market depth).
S5 BookMap is fine tuned for human visual perception, and allows to digest huge amounts of information, and unveil the real auction that takes place in the market. The only limitation of data precision is the resolution of the monitor.
What information does S5 BookMap present that was previously “lost”?
The mostly common tool to place a trade is a regular dom.
When trader look on a regular DOM, traders can see the size at each price level, however, it is very hard to see the changes and traders can’t tell when those limit orders placed in the market. With S5 BookMap traders can see it all. This enable traders to:
-
See the real liquidity levels (Real support or Real resistance)
-
Confirm Macro buy / sell decision with the Micro behavior in the order book
-
Identify that big players stepping in


What is the easiest way to add BM to an existing trading style or strategy?
The historical depth of market information is useful to traders because it shows not only where price is now, but where it is likely to be in the near future.
Our clients use S5 BookMap because
-
It provides information. All of it, concerning the market data.
-
It tells a story behind that information.
-
It helps to achieve the goal of better trading performance both in real time trading and by debriefing recorded trading sessions.
-
It is beautiful.
-
It educates about market data dynamic and microstructure, and about dominant market participants. Remember, a monthly chart is also an aggregation of the activity on the microseconds level.
Main Features
-
Volume and order flow
-
Insights into lack of order flow
-
Order flow flip from Bid to Ask
-
Change in liquidity
-
Price structure and order flow
-
Breakout and V bottom
-
Breakout and reversal
-
Stop run
-
Limit order book slope imbalance
-
Large lot tracker advantage
-
Market exhaustion in a trend
-
Aggressive limit orders

